Part 2: Model Selection and Training
Introduction
In Part 1, we laid the groundwork by collecting and cleaning NFL quarterback data from 1970-2022. We explored key stats, visualized their distributions, and ensured the data was cleaned to remove irrelevant outliers. With a clear research question—predicting total passing yards based on other QB stats—we now move into model selection and training, which are critical for building an effective machine learning model.
Choosing the right model is essential because it directly influences the accuracy and generalizability of the predictions. A well-suited model will capture the relationships in the data effectively, while a poorly chosen model might overfit, underfit, or simply miss key patterns. In this part we will dive into the models we considered and the reasons behind our final choice.
But before we can choose a model, we must decide between supervised and unsupervised learning and we should review the various types of models within those frameworks and understand their uses. Once we have narrowed to a model type, there are multiple models within that type that have their pros and cons.
Supervised Vs. Unsupervised Learning
Supervised Learning
Supervised learning relies on labeled datasets, where each input is paired with a corresponding output label. The primary objective is to predict outcomes or classify data based on the learned relationships between inputs and outputs. Techniques include classification (e.g. logistic regression), linear regression, decision trees, and neural networks. Email spam detection, image recognition, stock price prediction, and sentiment analysis are common applications of supervised learning. Normally we would want to use supervised learning when we have a clear target variable or outcome that we want to predict and the goal is to achieve high accuracy in predictions or classifications.
Unsupervised Learning
Unsupervised learning works with unlabeled data, aiming to identify patterns or to group similar data points without predefined labels. The focus is on discovering hidden patterns, relationships, or structures within the data. Unsupervised learning is often used for clustering (e.g., customer segmentation), anomaly detection, recommendation systems, and exploratory data analysis. Unsupervised techniques focus on clustering methods like k-means, DBSCAN, and dimensionality reduction. We should opt for unsupervised learning when we need to explore large datasets without labels and uncover underlying structures or patterns. Unsupervised learning is ideal for tasks where labeling data is impractical or too costly
In our case, since we have labeled data readily available and a clear output variable that we want to predict with as much accuracy as possible, we will us supervised learning.
Supervised Model Types
1. Classification
Classification models are used to predict discrete labels or categories. The goal is to assign input data into predefined classes. The two main types of classification models are binary classification, which is used to distinguish between two classes, such as spam vs. non-spam emails, and multi-class classification, which assigns data to one of three or more classes, such as classifying types of animals in images (e.g., cat, dog, bird).
2. Regression
Regression models are used to predict continuous numerical values. The aim is to model the relationship between input variables and a continuous output variable.
Examples include predicting house prices based on features like size, location, and age or forecasting stock prices or sales figures. Clearly, our task is to predict a continuous output variable, so we are looking for a regression model.
Overview of Regression Models
Regression models are designed to predict continuous outcomes, making them ideal for our goal of predicting total passing yards. Various models can be used depending on the nature of the data and the complexity of the relationships between variables.
- Support Vector Regression (SVR). SVR is a powerful regression algorithm that uses the same principles as SVM, optimizing the margin within a threshold. Use cases include predicting electricity consumption.
- K-Nearest Neighbors (KNN) for Regression. KNN is a simple algorithm that predicts the target value based on the average of the k-nearest neighbors. Great uses include things like predicting temperatures based on historical data.
- Ridge Regression. Ridge is a type of linear regression that includes a regularization term to prevent overfitting. One might use this for something like predicting sales based on marketing spend.
- Lasso Regression. Lasso is similar to Ridge Regression, but it performs variable selection by shrinking some coefficients to zero. Lasso has be used to predict variables like medical expenses.
- Linear Regression Linear regression is the simplest and most widely known regression model. It assumes a straight-line relationship between the independent variables (QB stats like completions and interceptions) and the dependent variable (total passing yards). While linear regression is easy to implement and interpret, it struggles to capture complex, non-linear relationships, which are common in real-world datasets like ours. Linear regression works well when there's a clear linear relationship between the variables. However, because QB stats often interact in non-linear ways, linear regression wouldn't capture the full complexity of our data.
- Decision Trees Decision trees improve upon linear regression by dividing the data into smaller subsets based on decision rules. Each decision rule splits the data into branches, making it easier to handle non-linear relationships. Decision trees are easy to interpret but can be prone to overfitting, where the model performs well on the training data but struggles with new data. Decision trees are useful when the relationships in the data are complex but need to be interpretable. However, single decision trees are not robust and often benefit from ensemble methods, which is why we turned to Random Forest.
- Random Forest (for regression) Random Forest is an ensemble learning method that builds multiple decision trees during training and aggregates their predictions. By introducing randomness—both in the selection of data and features for each tree—it helps reduce overfitting and improves accuracy. For some reasons that we will outline, Random Forest is the model that best fits our use case.
Advantages of Random Forest
- Feature Importance: Random Forest ranks the importance of different input features, which helps us identify which QB stats (e.g., interceptions, completions) are most predictive of passing yards.
- Handling Non-Linear Relationships: Unlike linear regression, Random Forest can capture complex relationships between variables. For example, a QB's attempts may not always lead to more yards if paired with a high number of interceptions. Random Forest can capture such nuances.
- No Assumption of Normality: Unlike many statistical models, Random Forest does not assume that the data is normally distributed, making it flexible for real-world datasets that may have skewed distributions or outliers.
Preparing Data for Training
1. Data Splitting
Splitting the data into training and testing sets is crucial for evaluating model performance. By using separate sets for training and testing, we ensure the model is evaluated on data it hasn't seen before, preventing overfitting and providing a more realistic measure of performance.
2. Choosing a Split Ratio
The most common split ratios are 70/30 or 80/20, where the larger portion of the data is used for training and the smaller portion for testing. In this analysis, we chose an 80/20 split. This ratio gives the model enough data to learn patterns while reserving enough data to evaluate its generalization performance.
3. Feature Selection
Feature selection is also an important consideration because not all variables contribute equally to the prediction. By selecting the most important features (or more accurately, eliminating the unimportant features), we can improve model performance and reduce complexity. In our case, key features like attempts, completions, and interceptions were selected based on their relationship to total passing yards. Additionally, some feature engineering was done, such as calculating yards per attempt, to better capture QB performance.
Build, Train and Test the Model
While it might sound scary to build a machine learning model, the good news is a lot of it is already done for us. If a person is comfortable in Python, sklearn makes it easy.
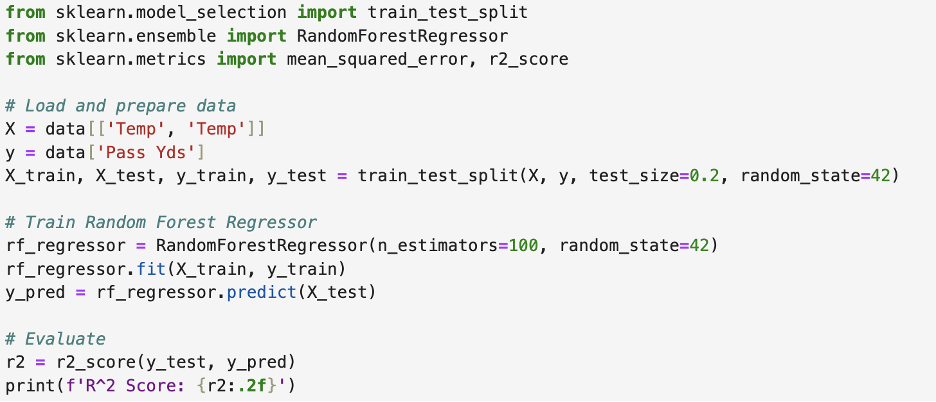
The logic is to predict a dependent variable, y, with an independent variable, x. SKlearn's prewritten functions make this simple. You can see I used the sklearn function, "RandomForestRegressor", to train our model here.
2. Hyperparameter Tuning
Hyperparameters are settings that control the learning process of the model. Tuning these hyperparameters can significantly impact performance. In Random Forest. Key hyperparameters include the number of trees (`n_estimators`) and the maximum depth of each tree (`max_depth`). I recommend starting with default settings and tuning these parameters to further improve the model's accuracy and generalization in future refining iterations. The code below being a second refinement, you will notice I use a non-default setting for n_estimators in this example under "Train Random Forest Regressor".

Initial Model Evaluation
Finally, we need to evaluate the results of our training. Our primary measure will be in the form of an R^2 score. The R^2 score measures how well a statistical model fits a dataset. It ranges from 0 to 1. A score of 0.81, for example, means that approximately 81% of the variance in the dependent variable is explained by the independent variable(s) in the model.
It suggests that the model accounts for 81% of the variability in the outcomes, while the remaining 19% is due to other factors not included in the model or random variation.
Generally, an R^2 of 0.81 is considered a strong fit, indicating a substantial relationship between the predictors and the outcome.
The initial testing results surprised me. Before the analysis I thought that touchdowns plus Completion % would be most predictive because the average touchdown drive in the NFL is 75 yards and, although some touchdowns are not the result of a long offensive drive, some long drives also end in interceptions. I also would have thought that Passer Rating (which includes passing attempts, completions, yards, touchdowns, and interceptions) might have been more predictive since it encompasses so much. What we learned is that the number of attempts combined with minimizing interceptions is the most predictive of total yards passing.
| Stat Combination | Correlation (R^2 score) |
|---|---|
| Yards per attempt + Attempts | 1.0 |
| Attempts + Interceptions | 0.89 |
| Touchdowns + Completion % | 0.81 |
| Passer Rating | 0.19 |
| Yards per attempt + 1st down % | 0.13 |
An R^2 score of .89 indicates that the combination of these to statistics explains 89% of the variation in total yards passing. This means only 11% of the variation in yards passing is explained by other variables. But R^2 score does not tell the entire story. We will delve into these results a little deeper in the next part where it will also be interesting to see if our results on the test data closely resemble our training results.
Conclusion
In Part 2, we explored the process of selecting and training a Random Forest model to predict NFL quarterback passing yards. We compared different regression models, highlighted the advantages of Random Forest, and walked through the data preparation and training steps. We also introduced the concept of hyperparameter tuning, which can help further refine the model's performance.
In Part 3, we will evaluate the model in more depth on the testing set, explore the insights gained from the feature importance rankings, and discuss how well the model generalizes to new data. Stay tuned as we continue to uncover how machine learning can help predict QB performance in the NFL!


