Part 3: Model Evaluation and Insights
Introduction
In Part 2, we focused on selecting and training a Random Forest model to predict NFL quarterback passing yards. We discussed why Random Forest was chosen over other regression models, the process of splitting the data into training and testing sets, and the importance of hyperparameter tuning for improving model performance. Now, in Part 3, we will evaluate the model's performance on the testing set and extract insights from the results. Model evaluation is critical because it tells us how well our model generalizes to new data and whether it has practical applications in real-world scenarios.
Model Testing and Evaluation Metrics
Once the model is trained, the next step is to evaluate how well it performs on unseen data---our testing set. This is crucial to understanding the model's ability to generalize and make predictions beyond the data it was trained on. It is in this step that we will see whether we might be vulnerable to overfitting (meaning the model was overly adapted to the training data and treated some of the noise as patterns) To evaluate our test, we use several evaluation metrics that provide a comprehensive view of the model's performance.
1. R² Score
The R² score, or the coefficient of determination, is a key metric for evaluating regression models. It measures how well the model explains the variance in the dependent variable (total passing yards) based on the independent variables (QB stats). The R² score ranges from 0 to 1, with 1 representing a perfect fit. An R² score of 0.85, for instance, would indicate that 85% of the variance in passing yards is explained by the model, with the remaining 15% due to other factors or noise in the data.
2. Mean Absolute Error (MAE)
MAE calculates the average absolute difference between the predicted values and the actual values. It provides a straightforward way to measure how far off the model's predictions are, on average. A lower MAE indicates a better-performing model.
3. Root Mean Squared Error (RMSE)
RMSE gives more weight to larger errors by squaring the differences between predicted and actual values before averaging. This metric is useful when we want to penalize larger errors more heavily, which is often important when predicting high-stakes outcomes like passing yards in a game.
4. Accuracy Score
The accuracy score indicates the percentage of predictions for which the residual (the difference between the prediction and the observed value) fell within an acceptable tolerance of error---say 10%. We will compare the accuracy score of the model on the training data to that of the model on the testing data to determine if we have overfitting.
Interpreting Results
After training the model, we ran it on the testing set to evaluate its performance. Here are the results based on the key metrics:
- R² Score: 0.89
The model explains 89% of the variance in passing yards meaning that only 11% of the variance is explained with other factors. This is an extraordinarily strong and valuable result indicating that the Random Forest model captures most of the relationships in the data.
- MAE: 254 yards
On average, the model's predictions were off by about 254 passing yards. While this might seem like a large error, it is important to remember that we are predicting a cumulative season-long statistic. The average total yards passing for quarterbacks in our dataset was 3850 yards per season. This means that the mean absolute error is about 6% on average. This margin is relatively reasonable for small datasets but even this does not tell the whole story. It may be that a few outliers contributed to this mean absolute error.
- RMSE: 325 yards
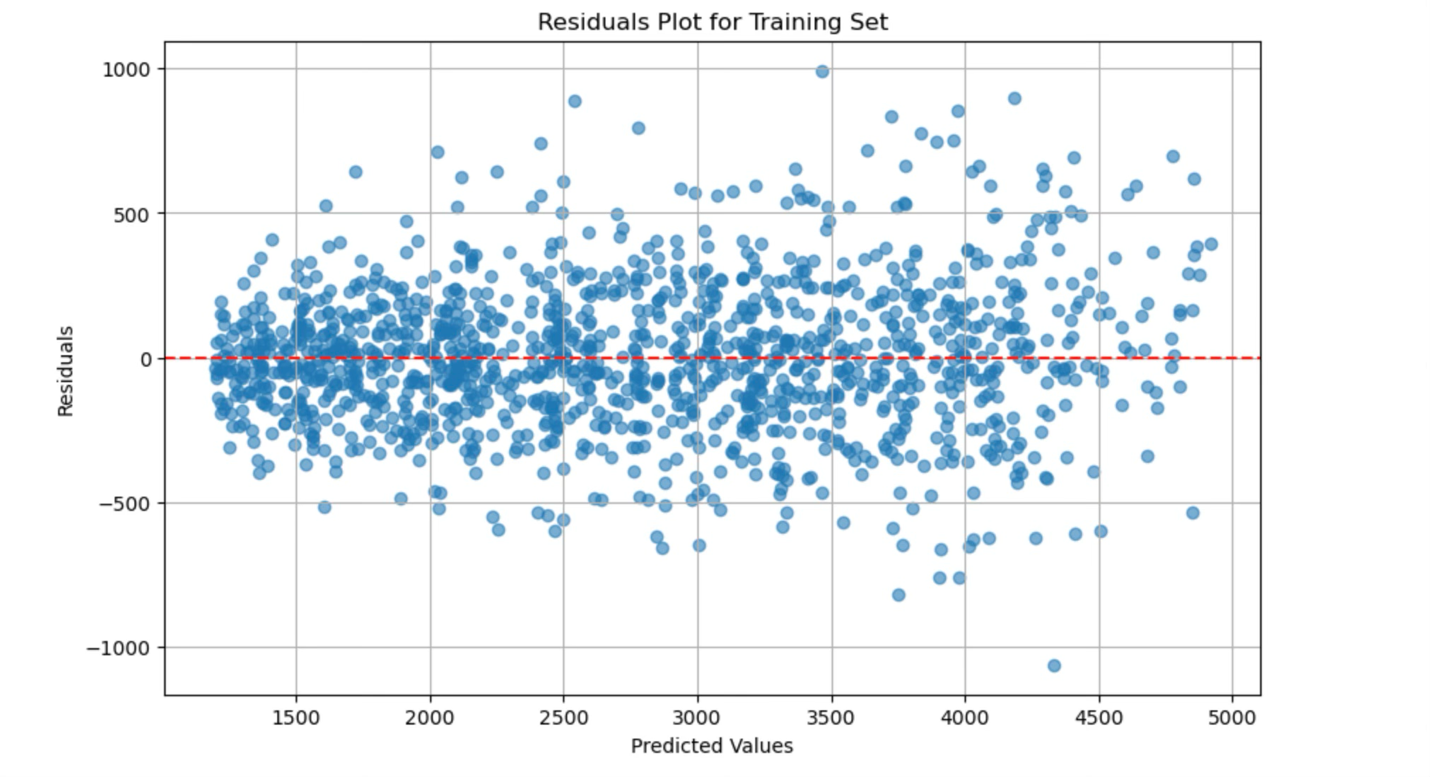
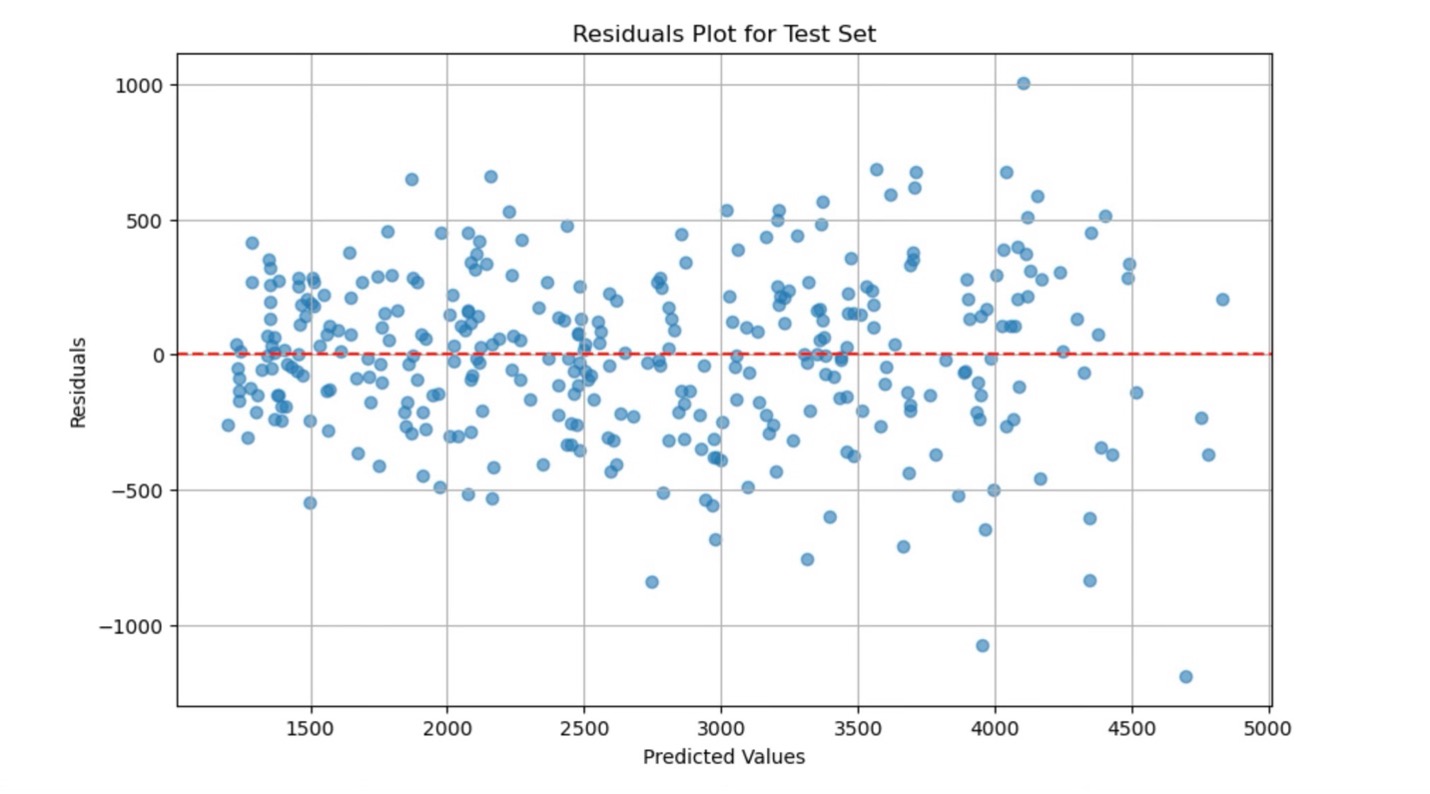
RMSE is very helpful in this case in showing that our model may be even more accurate in the majority of cases than MAE would suggest. The RMSE being higher than MAE indicates that a few outliers contributed significantly to the overall error because RMSE penalizes large inaccuracy to a greater degree since the differences between predicted and actual values are squared. This means that, but for a few outliers, our MAE might have been significantly lower.
- Visualizations
Additionally, residual plots were generated to examine the differences between the predicted and actual passing yards. These plots revealed that most of the model's predictions were close to the actual values, but a few outliers---extreme highs or lows in passing yards---contributed to the larger RMSE score. Also, another strong indicator that our model is fitting well to the data is that there are no non-random patterns discernable in our residual plots.


-Accuracy Score 94% training / 91% Testing
Do we have overfitting? Overfitting occurs when a model becomes too closely adapted to the training data, capturing even random fluctuations that do not generalize to other datasets. Significant differences between training data accuracy score and testing data accuracy may indicate overfitting. We do have a 3% difference in our results on the two datasets, so we may be seeing some overfitting. I'd say this is to be expected due to the small size of our data set. I suspect that a few players in our small data set had some unusual outlier performances that were learned by the model during training. Overall, even with this difference in testing-vs-training accuracy, I am comfortable that our model is going to be highly predictive.
We should be very pleased with these results. Because the test more or less mirrored our training results we can be reasonably confident that we are not seeing excessive overfitting. The accuracy of our predictions combined with the amount of variation explained by our model is a good sign that we have done a reasonable job in the fundamental steps that have come before.
Insights from the Model
The evaluation results provide useful insights into which combination of quarterback statistics are most predictive of passing yards and how effectively the model captures the complexity of the data.
1. Most Predictive Stat Combinations
As discussed in part 2, the Random Forest model highlighted some clear combinations of stats that were highly predictive of total passing yards. The combination of attempts and interceptions produced an R² score of 0.89, showing that minimizing interceptions while increasing attempts is a strong predictor of passing yards. While we might have expected this to be predictive of passing yards, the extremely high predictive value of this combination of stats was shocking.
| Stat Combination | Correlation (R^2 score) |
|---|---|
| Yards per attempt + Attempts | 1.0 |
| Attempts + Interceptions | 0.89 |
| Touchdowns + Completion % | 0.81 |
| Passer Rating | 0.19 |
| Yards per attempt + 1st down % | 0.13 |
2. Unexpected Findings
One surprising finding was that Passer Rating, a widely used metric for overall QB performance, was not as predictive of passing yards as expected. The R² score for Passer Rating was only 0.19, suggesting that while it is a comprehensive measure of QB effectiveness, it does not strongly correlate with total yards passing. This may be because Passer Rating includes factors like touchdowns, which are not direct contributors to passing yardage alone.
Practical Applications
Now that we have evaluated the model's performance, how can it be applied in real-world scenarios?
Getting the most out of a QB has been a question every head coach in the NFL has asked themselves. The game plan often decides how a QB will do. Do you let the QB try heaving a deep ball? Do you keep the QB throwing underneath? Well, let's look at what the model predicts. I have the model set up to take an INT value and an attempts value as an input and gives a predicted passing yards number as an output.
When given a smaller number of attempts and interceptions, it predicted a larger number of passing yards than when given a larger number of attempts and interceptions. This means that having a QB like Tua Tagovailoa who likes to keep the ball underneath will have more passing yards than a QB like Josh Allen who likes to launch a deep ball every play. And, in fact, last year this turned out to be the case, with Tua leading the league in passing yards with fewer attempts and interceptions than Josh Allen, who is a bolder quarterback and an exciting player to watch. You just have to expect Allen will throw a lot of interceptions.
Conclusion
In this part of the series, we focused on evaluating the Random Forest model and extracting insights from the results. The model performed strongly, with an R² score of 0.89, indicating that it explains most of the variance in passing yards. Key combinations like yards per attempt and attempts were found to be highly predictive, while Passer Rating was surprisingly less useful for predicting total passing yards.
Although there will not be a part 4 in this series, looking ahead, if you like this model, my advice would be to focus on refining it, addressing its limitations, and exploring future directions for improving its accuracy. Think about how you would extend the model, such as taking into account weather and the strength of opposing defenses. As we continue this journey, the power of machine learning in sports analytics becomes increasingly evident, offering new ways to understand and predict player performance in real time.


