Visualizing Kafka Log Data with Amazon QuickSight
In this article, you'll learn how to connect Amazon QuickSight to DynamoDB and visualize real-time Kafka log data with dynamic dashboards. By incorporating anomaly detection results from Amazon SageMaker, you can create advanced visualizations such as line charts, heat maps, and conditional formatting to monitor system performance and log anomalies. QuickSight’s interactive and real-time dashboards allow for deep insights into log trends, empowering users to quickly identify and address potential issues within their data pipelines.

Todd Bernson
2024-10-21

In today’s data-driven world, visualizing log data and anomaly detection results is a must for gaining real-time insights into system performance, detecting potential issues, and making informed decisions. Amazon QuickSight, a cloud-powered business intelligence service, allows you to visualize your data directly from various sources, including DynamoDB, providing interactive and dynamic dashboards for real-time insights. In this article, we will explore how to connect QuickSight to DynamoDB, build dashboards that visualize Kafka log data, and create advanced charts to highlight anomaly detection results from SageMaker.
Connecting QuickSight to DynamoDB
To visualize the processed Kafka log data stored in DynamoDB, the first step is to establish a connection between Amazon QuickSight and your DynamoDB table.
Enable QuickSight Access to DynamoDB
Ensure that your QuickSight account has the required permissions to access your DynamoDB data. You can do this by enabling the necessary permissions in the AWS Management Console:
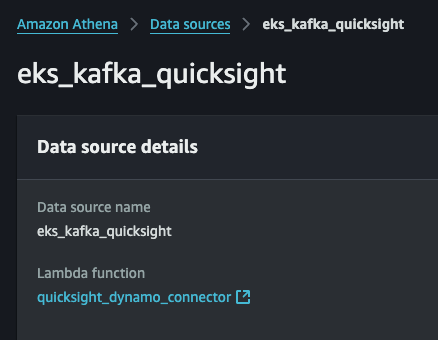
- Go to Athena > Data sources
- Create a data source > DynamoDB
- Allow AWS to create needed lambda with CloudFormation
- Go to Amazon QuickSight.
- Navigate to Manage QuickSight and choose Security & permissions.
- Scroll to Athena access to AWS services and ensure Athena is selected. If it is not, select it and save changes.
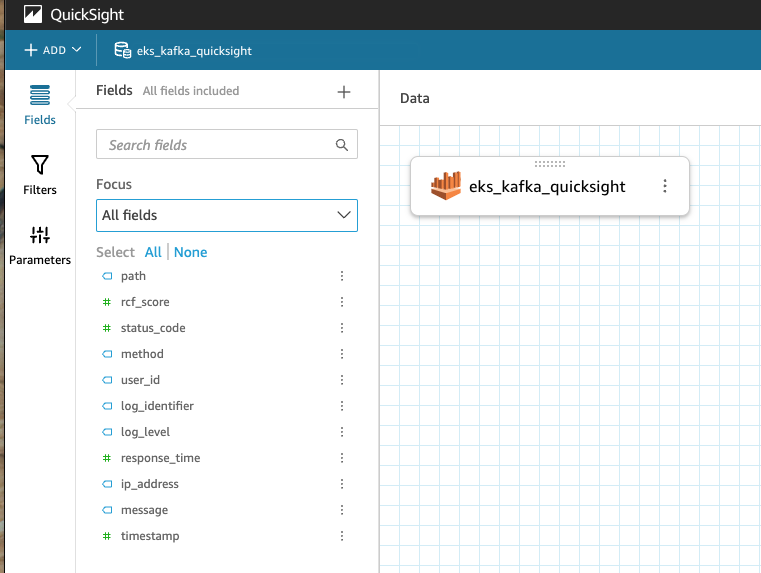
Create a Dataset in QuickSight
After enabling permissions, you can now create a dataset in QuickSight from DynamoDB:
- Go to the Datasets tab in QuickSight and click New Dataset.
- Choose Athena as the data source.
- Select your table and define the attributes to be included in the dataset (e.g., logId, timestamp, anomalyScore, and logData).
- Once selected, click Import to SPICE for faster analysis or Direct Query if you prefer real-time data fetching.
Prepare Data for Visualization
After importing the data, you can clean and prepare it for visualization. For example:
Building QuickSight Dashboards for Real-Time Insights
Once the dataset is set up, the next step is to build dashboards that provide real-time insights into Kafka log data. Dashboards allow you to create a visual representation of the data and display it in a user-friendly format for easy analysis.
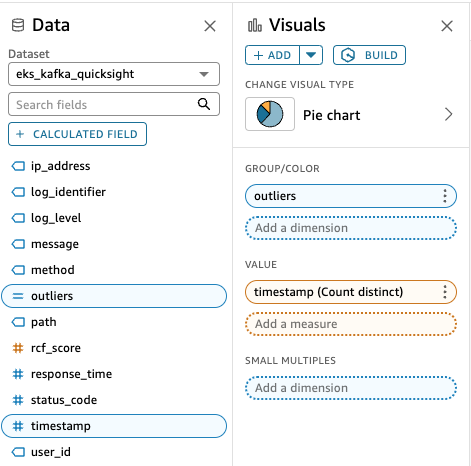
Advanced Visualizations in QuickSight
To create more advanced and detailed insights into your Kafka log data, QuickSight offers powerful visualization and customization options. Here are some techniques to create advanced charts for your dashboard.
Customizing Line Charts for Trend Analysis
You can customize line charts to show different log metrics (e.g., response time, status codes) over time. Use color coding to differentiate between normal and anomalous logs.
Example: Use logId to group lines by unique logs and color the lines based on whether the log contains an anomaly.
- X-axis: timestamp
- Y-axis: response time
- Group by: logId
- Color by: anomalyScore > 3.0 (use red for anomalies)
Heat Maps for Anomaly Distribution
Use heat maps to visualize the distribution of anomalies over time and across different metrics. This can help identify patterns or periods of time when anomalies occur frequently.
##Create a Heat Map visualization:##
- Use timestamp on the X-axis and anomalyScore on the Y-axis.
- Set color intensity to represent the frequency or severity of anomalies.
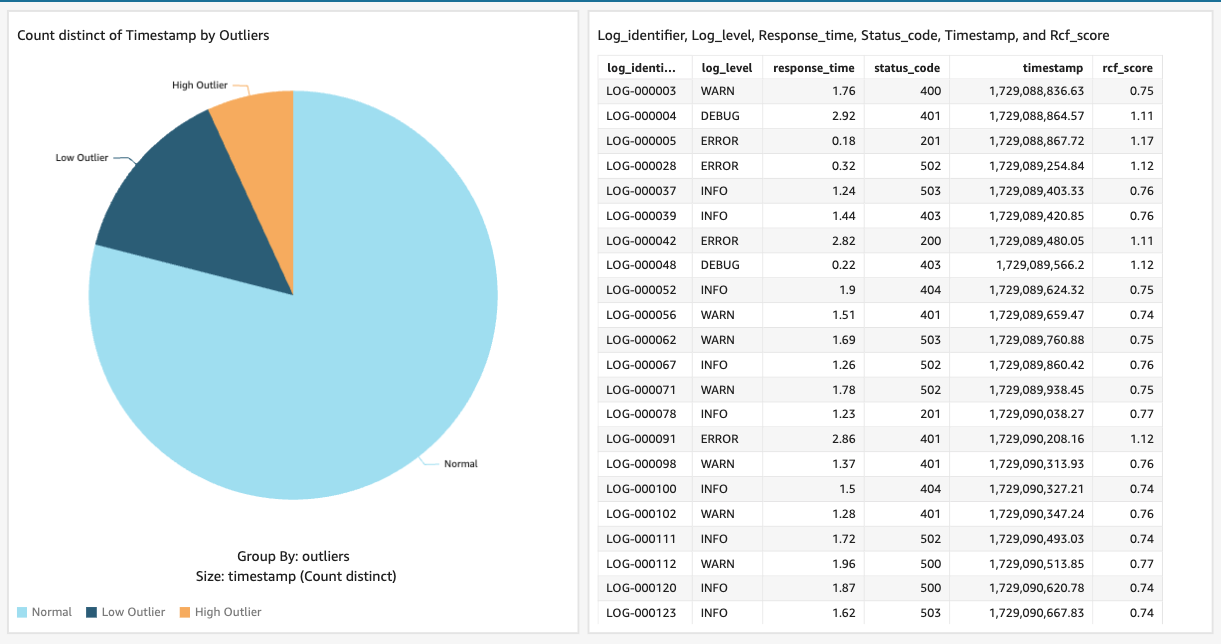
Adding Conditional Formatting
Use conditional formatting to highlight key metrics or thresholds. For example, apply conditional formatting to the anomalyScore field to change the color of high anomaly scores, making it easier to spot significant outliers.
Integrating Multi-Source Data
If your pipeline involves multiple data sources (e.g., logs from different Kafka clusters), you can combine these datasets into a single dashboard by creating joins or using calculated fields.
Example: Use logId to join data from multiple sources and create a combined visualization that shows both Kafka and system metrics (e.g., CPU usage, memory, etc.).
Key Takeaways
- Real-Time Insights: QuickSight enables you to visualize Kafka log data in real time, providing actionable insights into system performance and log trends.
- Anomaly Detection: By integrating SageMaker anomaly scores into QuickSight dashboards, you can easily monitor outliers and investigate potential issues in your log streams.
- Interactive Dashboards: QuickSight’s filters and drill-down capabilities make it easy to build interactive dashboards that provide deep insights into logs, enabling you to quickly analyze anomalies or performance trends.
- Advanced Visualizations: With features like heat maps, conditional formatting, and multi-source data integration, QuickSight allows you to create highly customized and advanced visualizations that deliver detailed insights into log data. Amazon QuickSight provides a powerful and flexible platform for visualizing Kafka log data and identifying patterns or anomalies in real time. By connecting QuickSight to DynamoDB and using its interactive dashboard features, you can unlock valuable insights from your log data to monitor, diagnose, and improve your system’s performance.
Read More
View all posts
AI/ML
Why Enterprise AI Must Be Application-Led, Not Agent-Led
A deep dive by Todd Bernson, CTO and Chief AI Officer, on why enterprise AI systems should be architected as application-led, deterministic platforms with embedded agentic AI—not fully autonomous agents. This article explains how API-first, governed, multi-channel architectures deliver higher reliability, compliance, scalability, and business value in real-world Fortune-500 environments.
Todd Bernson
2025-12-02

AI/ML
Application-First Agentic AI
Application-first agentic AI is emerging as the only reliable path to real enterprise ROI. In this in-depth analysis, Todd Bernson, CTO & CAIO, breaks down why most generative AI initiatives stall in production—and how disciplined enterprise architecture, deterministic workflows, and narrowly scoped AI agents can finally unlock repeatable business value. Using a real sprint-intelligence system as a case study, the article shows how organizations can combine serverless engineering, structured orchestration, and constrained LLM reasoning to reduce reporting effort, increase trust, eliminate hallucinations, and deliver actionable insights across engineering, operations, compliance, and customer experience.
Todd Bernson
2025-11-28

AI/ML
Why 95% of AI Projects Fail and How to Be Among the 5% That Succeed

Lee Hylton
2025-08-22